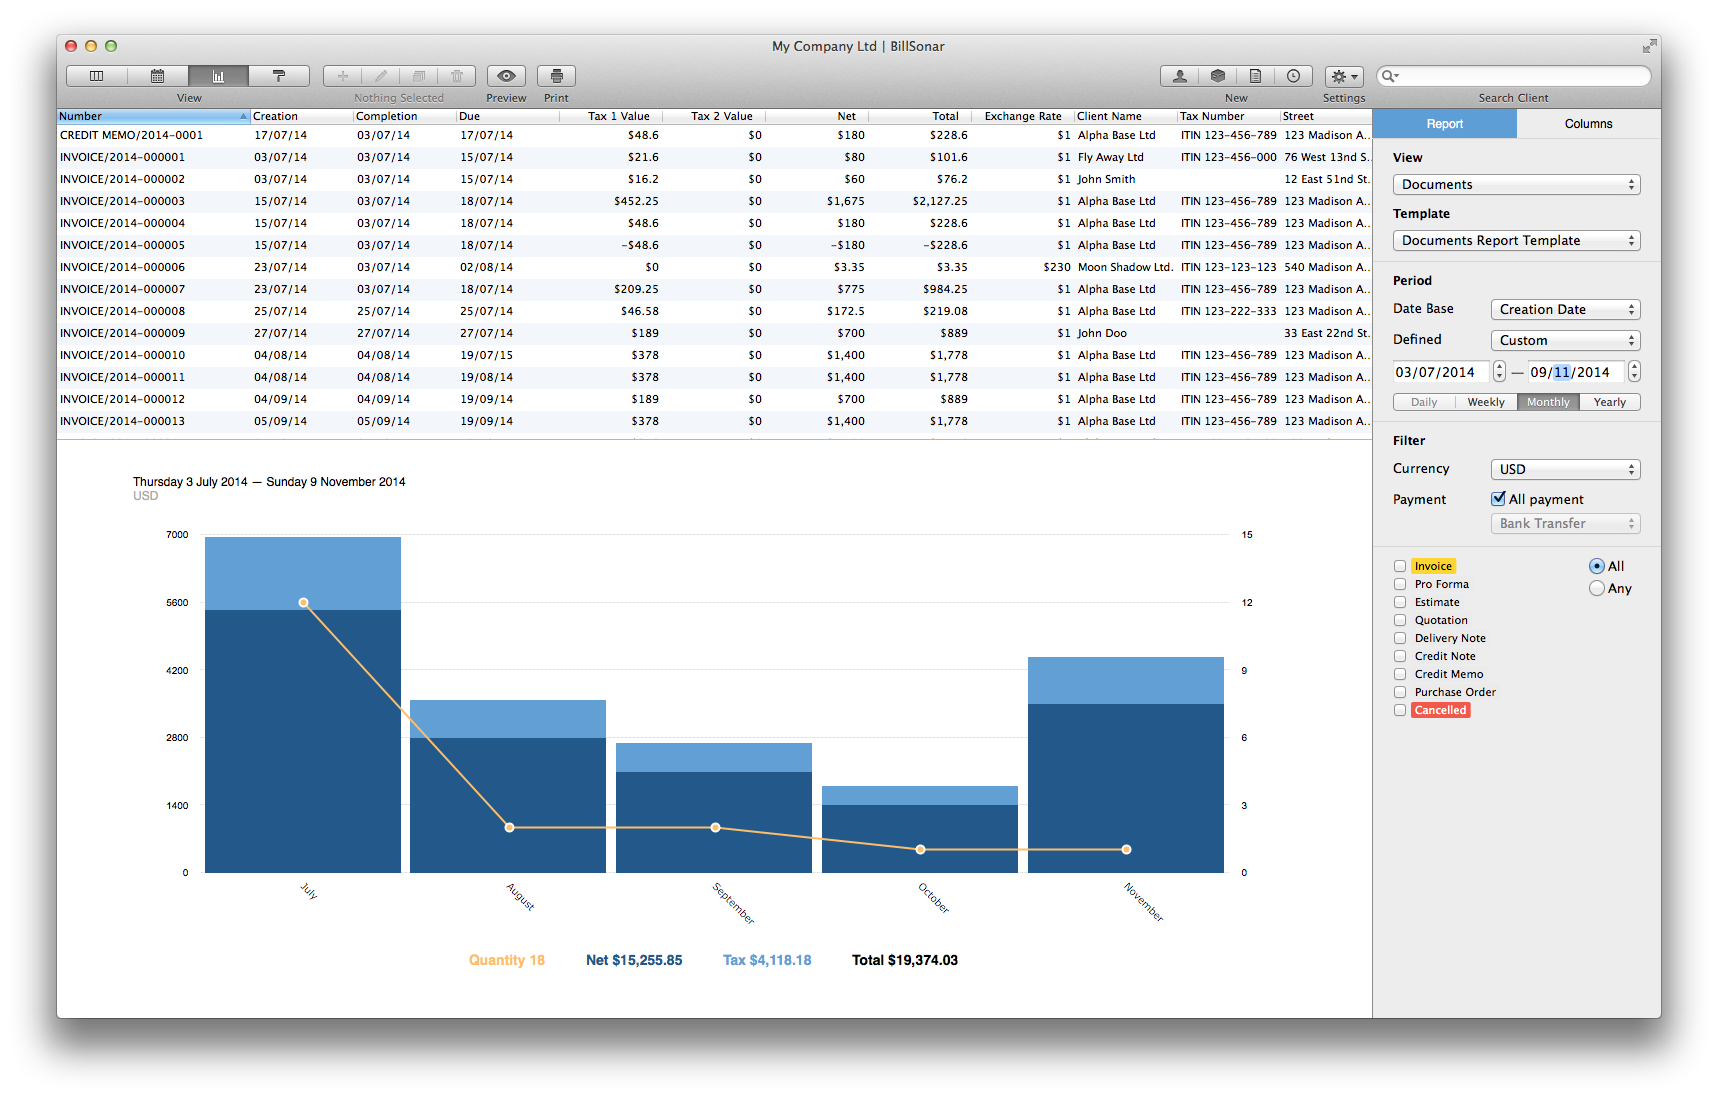
With the help of the software, you can request your data by creating
many pliantly customizable statements. The result of querry appears as a chart at the top of the screen,
and also as a diagram at the bottom.
Parameters of the querry can be set at the right side column's "Statement options" tab
ElFirst choose from the views:
- Documents
- Document lines
- Client summary
- Product summary
After that, from the menu expanding, choose the statement template you would like to use.
Set the data of the period desired to querry. Documents can be querried by their fill-out date, fulfillment
date or prompt. The appearance of the bottom diagram can be set to be daily, weekly, monthly or yearly.
There is an opportunity of grouping by method of payment or foreign exchange. Datas can be grouped further
by tags. For this, check in the box next to the tags you want to appear.
Switching to tab "Columns" you can show/hide the columns featured in the querry.
For detailed description of creating a querry template, Jump to chapter "Design editor".

